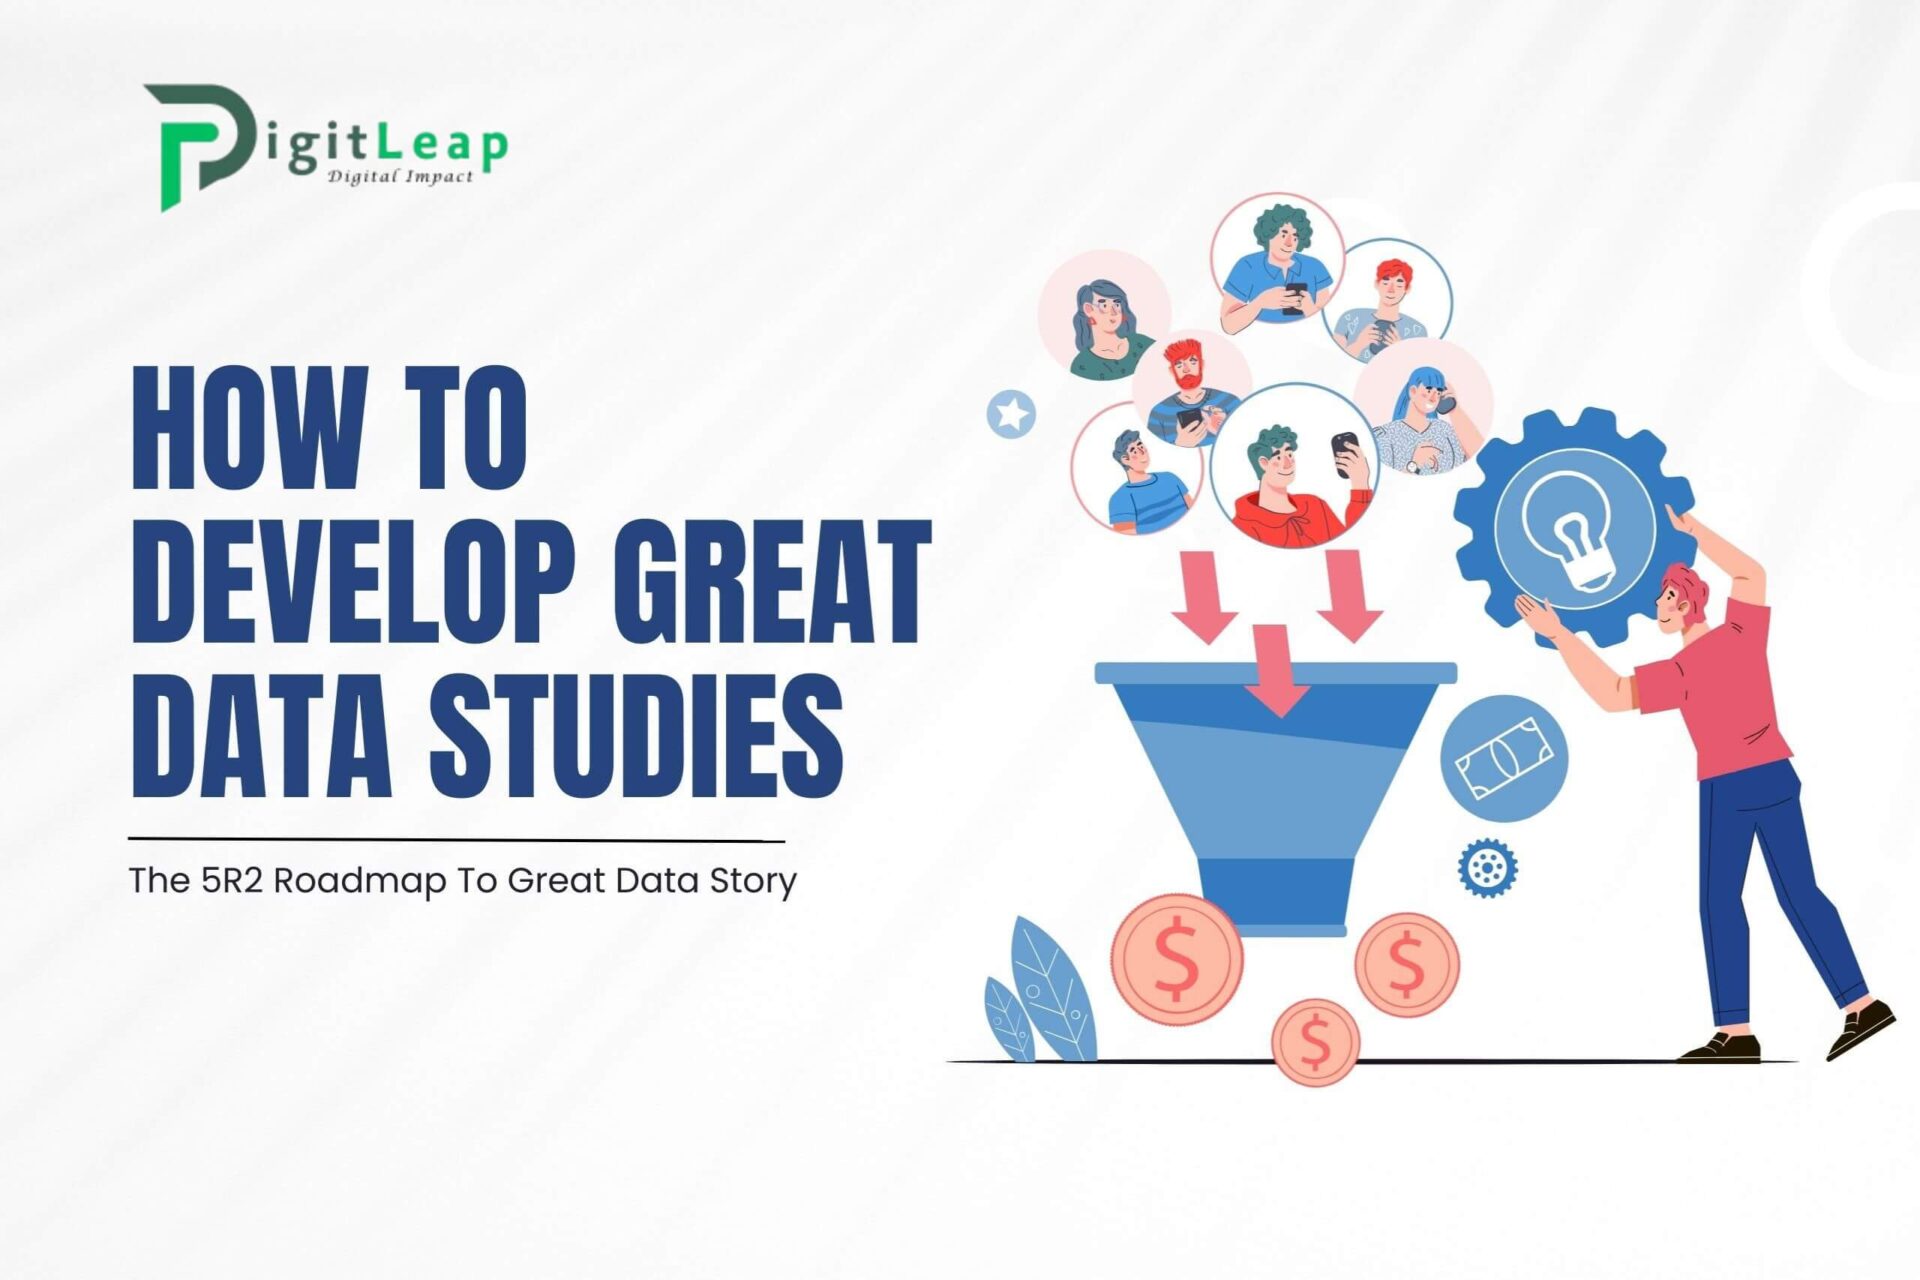
How To Develop Great Data Studies – The 5R2 Roadmap To Great Data Story
Data is everywhere. We’re surrounded by numbers, graphs, and statistics, but the real challenge isn’t just gathering data—it’s transforming that data into a compelling story that communicates insights and drives decision-making. A great data study isn’t just about facts; it’s about how those facts connect to a bigger narrative. Enter the 5R2 Roadmap, a simple framework to help you turn data into a powerful story. If you want to learn how to build a strong, meaningful data study, this guide will show you how.
What is the 5R2 Roadmap?
The 5R2 Roadmap is a method designed to make sure your data study not only makes sense but also tells a story that resonates with your audience. It’s a step-by-step approach to structuring your data, insights, and the message you want to deliver. The 5Rs stand for Relevance, Reliability, Robustness, Readability, and Resonance, while the 2Rs refer to Results and Recommendations. These elements, when combined, create a roadmap that takes your data from raw numbers to an impactful conclusion.
1. Relevance
The first and most important step in any data study is relevance. If your data isn’t relevant to your audience, your study won’t capture attention. Ask yourself: Why does this data matter? Who will benefit from it? Is it addressing a current issue, trend, or business challenge? Relevance ensures that the time and resources spent on data collection and analysis are worth it.
For example, if you’re studying customer satisfaction, ensure your data touches on issues that are important to the business, such as response time, service quality, or customer loyalty.
2. Reliability
Next comes reliability. In data studies, unreliable data can lead to wrong conclusions and poor decisions. Reliable data is accurate, consistent, and trustworthy. Whether you’re collecting data from surveys, databases, or market research, make sure your sources are credible.
For instance, if you’re pulling data from social media, you need to ensure the platform’s audience aligns with your study’s goals. And if you’re collecting survey data, your sample size should be large enough to draw meaningful conclusions.
3. Robustness
A robust data study goes beyond surface-level analysis. Robustness means your data and analysis are comprehensive, in-depth, and account for variables that might impact your findings. In short, it’s about ensuring your conclusions are strong and can stand up to scrutiny.
When conducting a study, think of questions like: Have I considered all relevant factors? Did I control for potential biases? Robustness helps build confidence in your findings and makes them more valuable to decision-makers.
4. Readability
Even the best data studies can fail if they aren’t easy to understand. Readability is all about making your data digestible for your audience. This means presenting your findings clearly, avoiding jargon, and using visual aids like graphs, charts, and infographics.
Think about how a non-technical person would interpret your data. Is the message clear? Can someone without a data science background easily grasp your insights? A readable data study breaks down complex information into simple, actionable insights.
5. Resonance
Resonance is what makes your data story stick. It’s about how well your findings connect with your audience’s emotions or goals. Does the story you’re telling through the data inspire action? Does it solve a problem or confirm something your audience suspected but didn’t have the data to prove?
For instance, if you’re presenting data to business leaders about a new market opportunity, you need to make sure your data resonates with their objectives. This could mean focusing on profitability, efficiency, or growth potential.
6. Results
The 2Rs of the 5R2 Roadmap begin with Results. Once you’ve analyzed your data, it’s time to present the results clearly. Results should provide definitive answers to the questions you set out to answer in your study. This is where your hard work pays off—presenting clean, accurate, and insightful findings.
Make sure to highlight the most important results and back them up with the data that supports them. Whether you’ve found a correlation, a trend, or an unexpected insight, the results should speak for themselves.
7. Recommendations
Finally, the last step is recommendations. What should your audience do with this data? Recommendations turn insights into actionable steps. Based on the results of your study, suggest clear, practical actions your audience can take.
For example, if your data study shows that customer satisfaction improves when customer service reps respond within 30 minutes, your recommendation could be to invest in more staff or automation tools to meet that timeline. Recommendations bridge the gap between data and decision-making.
Putting the 5R2 Roadmap into Action
Let’s say you’re working on a data study for a marketing campaign. You might start by focusing on the Relevance—are you looking at the right metrics for campaign success? Then, you’d ensure the Reliability of your data sources, such as web analytics or CRM data. Next, you’d test the Robustness of your analysis, maybe by comparing campaign performance across different audience segments or time periods.
When it comes to Readability, you might use charts to visualize click-through rates or conversion rates. And for Resonance, you’d focus on how your campaign results align with the company’s overall goals, like increasing revenue or brand awareness. Finally, you’d present your Results, showing what worked and what didn’t, followed by your Recommendations on how to improve future campaigns based on these insights.
Conclusion
The 5R2 Roadmap offers a simple yet effective way to turn raw data into a compelling narrative. By ensuring your study is relevant, reliable, robust, readable, and resonates with your audience, you can deliver meaningful results and actionable recommendations. Remember, data is more than just numbers—it’s a story waiting to be told. And when you tell that story well, it can drive real change.
At DigitLeap, we believe in the power of data-driven decisions. Whether you’re conducting a simple survey or a complex data study, we’re here to help you turn data into actionable insights that move your business forward.

